Blog Article
Oregon Football 2025: The Championship Window Is Wide Open
The Oregon Ducks are about to find out if lightning can strike twice.
After their historic undefeated regular season and Big Ten Championship in 2024, the Ducks face a moment of truth. Can they maintain championship-level performance while replacing Heisman finalist Dillon Gabriel and 10 NFL Draft picks? Or will 2024 prove to be a magical one-year run that can’t be replicated?
The answer lies in how quickly Oregon’s young stars can fill massive shoes.
The Foundation Is Rock Solid
Oregon didn’t just win in 2024—they dominated.
Their numbers tell the story of a program firing on all cylinders:
- 13-1 overall record with a perfect 12-0 regular season
- 34.86 points per game (4th nationally)
- Only 19.43 points allowed per game
- Signature wins over Ohio State (32-31), Michigan (38-17), and Washington (49-21)
- First Big Ten Championship in program history
The only crack in the armor? A sobering 41-21 loss to Ohio State in the Rose Bowl exposed defensive vulnerabilities against elite competition.
But here’s what that loss represents: proof that Oregon belongs on the biggest stage, with lessons learned about what it takes to win at the highest level.
The $64,000 Question: Can Dante Moore Be “The Guy”?
Everything hinges on the quarterback position.
Dillon Gabriel’s departure creates the most significant question mark on Oregon’s roster. Enter Dante Moore, the former five-star UCLA transfer who spent 2024 learning Will Stein’s system from the sidelines.
Here’s why Moore could explode in 2025:
- Full year of development in Stein’s offense without game pressure
- Elite arm talent that made him a top-5 recruit
- Quick decision-making system perfectly suited to his skill set
- Chemistry built with receivers throughout spring practice
On3 analyst JD Pickell believes Moore’s patient development was crucial: “My biggest takeaway is he is going to be able, I think, play with better anticipation having sat for a year. Anticipation in Will Stein’s offense = points.”
Moore’s 2023 UCLA experience—52.4% completion rate, 11 TDs, 9 INTs—represents learning on the fly in a complex system. Now he gets to showcase what a year of preparation can do.
The backup situation adds intrigue with Austin Novosad choosing to stay rather than transfer, creating valuable depth behind Moore.
The Receiving Corps Just Got Very Interesting
Oregon’s passing attack faces both crisis and opportunity.
The crisis? Evan Stewart, projected as the Ducks’ top receiver, suffered a knee injury believed to be a torn patellar tendon that could sideline him for the entire 2025 season. Stewart’s 48 catches for 613 yards in 2024 represented crucial production that must be replaced.
The opportunity? Enter the “Moore to Moore” connection.
Five-star freshman Dakorien Moore—the nation’s top-ranked receiver—arrives with elite credentials and early raves from teammates. Gary Bryant Jr. called him “very explosive” and praised his versatility: “Can play any position in the receiver room from X, Y, Z, A. Explosive receiver. Got good hands. Got good routes.”
The supporting cast includes:
- Justius Lowe (21 catches, 203 yards in 2024)
- Gary Bryant Jr. (limited by injury but productive when healthy)
- Malik Benson (Florida State transfer, adding depth)
- Jeremiah McClellan (emerging young talent)
With Stewart’s absence creating immediate opportunities, expect Dakorien Moore to fast-track into a starring role alongside quarterback Dante Moore.
Defense: Elite Edge Rush Meets Secondary Youth
Oregon’s defense returns its most dominant weapon in Matayo Uiagalelei.
The All-Big Ten edge rusher led the team with 10.5 sacks and 12.5 tackles for loss, establishing himself as one of college football’s premier pass rushers. Paired with returning edge rusher Teitum Tuioti and USC transfer Bear Alexander on the interior, Oregon’s pass rush should remain elite.
The secondary tells a different story entirely.
After sending seven defensive backs to NFL camps, Oregon rebuilt with elite recruits:
- Five-star cornerback Na’eem Offord (nation’s top-ranked corner)
- Five-star safety Trey McNutt (elite athleticism and range)
- Multiple four-star additions providing depth
“I feel like I felt the most love at Oregon,” Offord said about his recruitment. “The whole staff had been recruiting me from the beginning. Everything, just everything there. I feel like Oregon just fits me.”
The question isn’t talent—it’s experience. These young stars must perform immediately against Big Ten offenses that will test every coverage.
Dan Lanning’s Recruiting Machine Keeps Rolling
Oregon’s 2025 recruiting class proves this success isn’t accidental.
The numbers are staggering:
- No. 3 national ranking according to 247Sports
- Three five-star prospects (most in program history)
- 15 four-star recruits
- Best recruiting class in the Big Ten
Expert Matt Prehm from Ducks Territory summarized Oregon’s talent level: “They’ve recruited as well as they’ve ever done at Oregon. They have NFL players on both sides of the football. They have first-round draft picks on both sides of the football. This is as talented of a group as possible.”
The 2026 class momentum continues with multiple five-star commitments and official visits from top prospects, indicating sustainable excellence rather than a one-year flash in the pan.
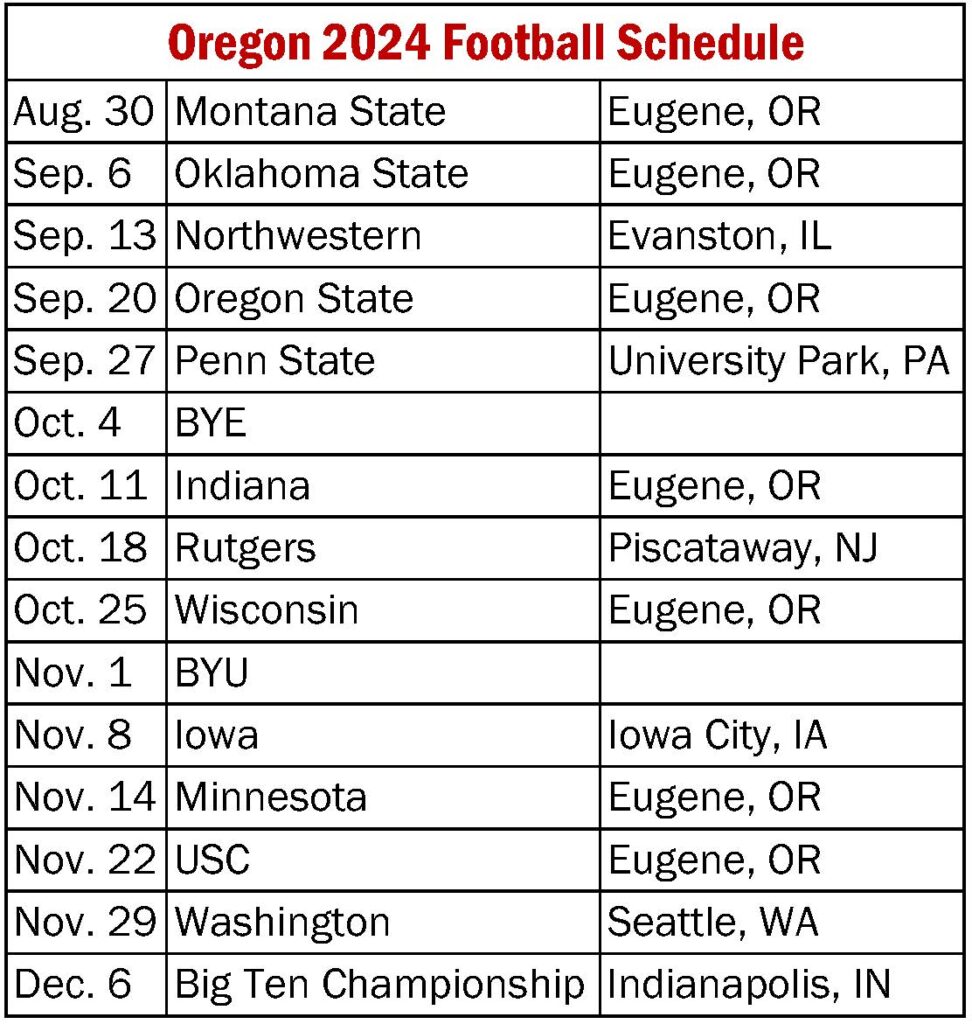
Schedule Sets Up for Another Championship Run
Oregon catches two massive breaks in 2025.
They avoid both Ohio State and Michigan in regular-season play, removing the conference’s two biggest threats from their path to another Big Ten Championship. The toughest tests come in late September (at Penn State) and November road trips to Iowa and Washington.
FanDuel Sportsbook has set Oregon’s win total at 10.5, reflecting both the team’s recent consistency and the uncertainty surrounding its roster. The Ducks have hit double-digit wins every full season since 2019, establishing championship-level expectations.
“I also think 12-0 might happen again,” said Prehm. “They don’t play Ohio State. They don’t play Michigan. I honestly think the schedule sets up where if Dante Moore is as good as we think he is, the backend on defense connects maybe sooner than later.”
The Unfinished Business
Several questions remain unanswered as we head into 2025.
The most pressing concerns:
- Quarterback depth behind Moore remains unproven
- Secondary relies heavily on talented but inexperienced players
- Special teams consistency (particularly kicking) wasn’t addressed
- Veteran leadership must emerge from new voices
These aren’t fatal flaws—they’re growing pains for a program transitioning from breakthrough to sustained excellence.
Lightning Is About to Strike Again
Oregon enters 2025 with everything needed for another championship run.
The infrastructure is championship-caliber: elite recruiting, proven coaching, favorable schedule, and core talent returning at key positions. The expanded 12-team College Football Playoff provides multiple paths to postseason success.
The real question isn’t whether Oregon can compete—it’s whether they can elevate their ceiling even higher.
2024 proved Oregon belongs among college football’s elite. 2025 will determine if they’re ready to stay there permanently. With Dante Moore under center, Dakorien Moore stretching defenses, and Matayo Uiagalelei terrorizing quarterbacks, the pieces are in place for something special.
The championship window isn’t just open—it’s wide open.